We Are All Visual Learners
As an undergraduate physics student I thought I really understood physics. I loved the higher level math necessary to solve problems in my classes. Differential equations (ordinary and partial), Fourier analysis, the calculus of variations; it was all so interesting and challenging, and solving those abstract problems with these abstract mathematical tools made me believe that I had a concrete understanding of physics...until I had to explain it to someone that didn't know anything about the subject. When I first started teaching as a tutor in college, I taught the same way I had been taught: solving problems on a whiteboard.
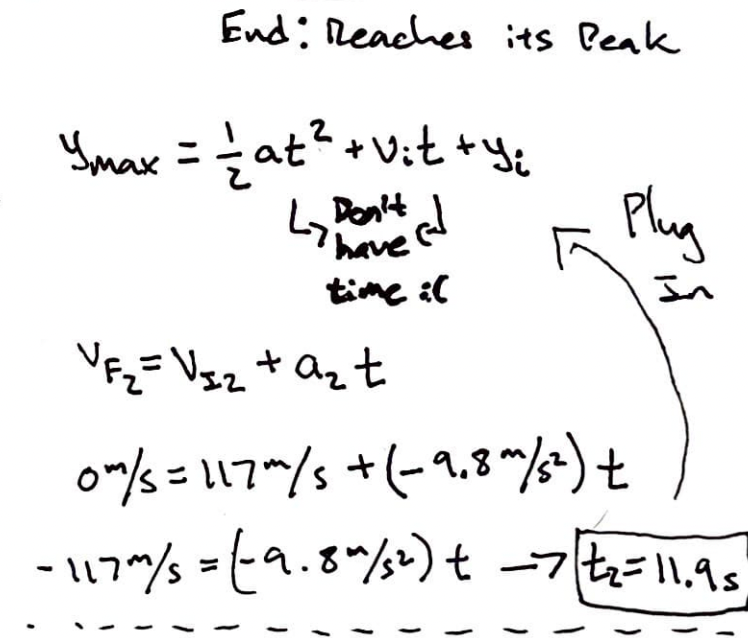
I quickly learned that even though this made sense to me, it hardly made any sense to the disinterested pre-med freshman or high school upperclassman. Over the years I refined my teaching and presented students with multiple means of representation. Usually I had my students ground themselves with something tangible and relatable. As we dove deeper into the topics and things got more abstract, I always created visualizations to aid them.
Juuso Koponen and Jonatan Hildén state in Data Visualization Handbook that "visual elements help viewers to understand the structure of data and to form a quick, intuitive overall picture of a phenomenon, even a complex one." More frequently my visualizations were more conceptual than data-driven, but their effectiveness couldn't be more evident. Topics that demand a large amount of higher-order abstract thinking, such as energy and momentum, became easier to digest for my students.
Even though I left education, I often think about continuing to help others learn and sharing my knowledge. I take a lot of inspiration from others that do the same online: KhanAcaademy, 3Brown1Blue, FlippingPhysics, etc. They have been established for some time now, but recently I found this article by Yi Zhe Ang which visualizes a common technique used to analyze data.
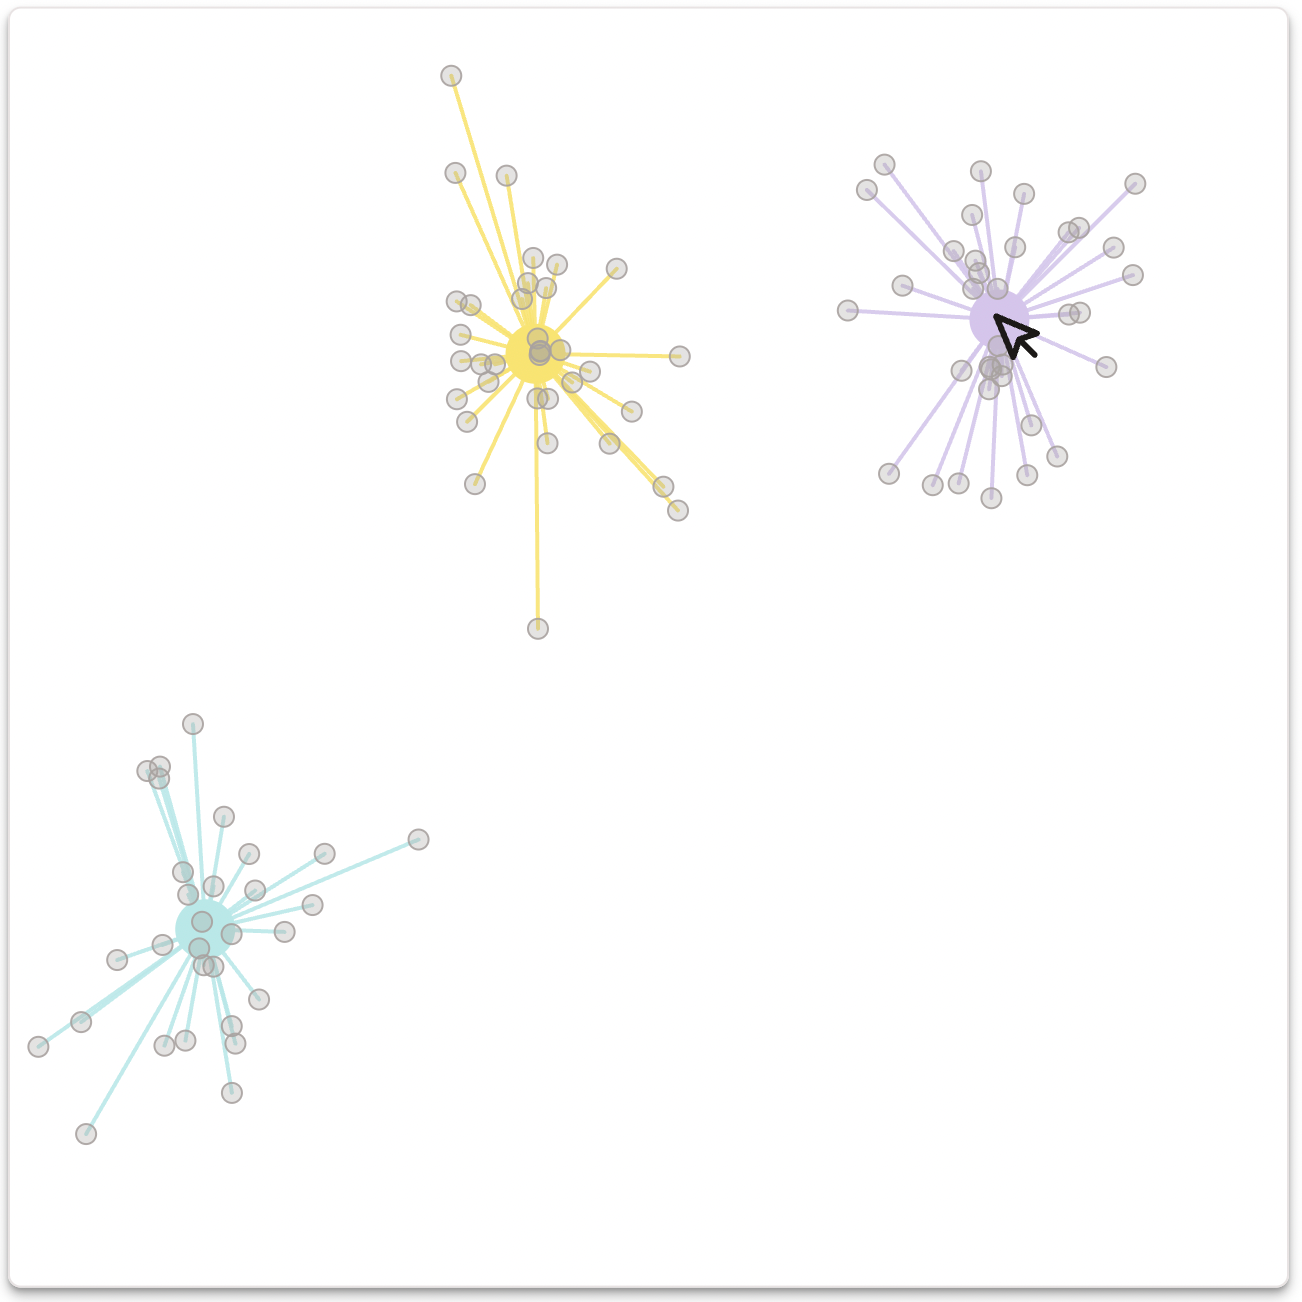
This type of work is something I aspire to be able to complete and share with people online. It takes a highly technical idea and breaks it down in way that makes it easy to pick up and read for anyone regardless of their academic background. It creates an intuitive overall picture of a complex idea.